Are you a project manager looking to streamline your project planning and management process? If so, you’ve likely come across the term “Gantt chart” in your research. But what exactly is a Gantt chart in project management, and how can it benefit your projects?
In this comprehensive guide, we will delve into the world of Gantt charts and explore their importance in project management. We will also provide practical tips on how to create and use Gantt charts effectively, as well as compare Gantt charts with other project management tools. Additionally, we will share valuable insights on optimizing Gantt charts for better project management.
By the end of this guide, you will have a clear understanding of the Gantt chart and how it can revolutionize your project management approach. So, let’s dive in and unlock the power of Gantt charts for your projects.
Understanding the Gantt Chart: A Comprehensive Guide for Project Managers
The History and Purpose of the Gantt Chart
The Gantt chart, named after its creator Henry Gantt, is a popular project management tool used to visually represent the schedule of tasks and their dependencies. It was first introduced in the 1910s and has since become an essential part of project planning and tracking. The main purpose of a Gantt chart is to provide project managers with a clear and easy-to-understand timeline of the project, allowing them to allocate resources, set deadlines, and monitor progress.
Key Components and Benefits of Gantt Charts
One of the key components of a Gantt chart is the horizontal timeline, which represents the duration of the project. Each task is represented by a bar on the timeline, with its length corresponding to the estimated duration. Dependencies between tasks are indicated by the positioning of the bars, allowing project managers to identify critical paths and potential bottlenecks. The visual nature of Gantt charts makes it easy to communicate the project timeline to stakeholders and team members, fostering better collaboration and understanding. Additionally, Gantt charts can help project managers identify resource conflicts, track progress, and make adjustments to the schedule as needed.
Best Practices for Using Gantt Charts
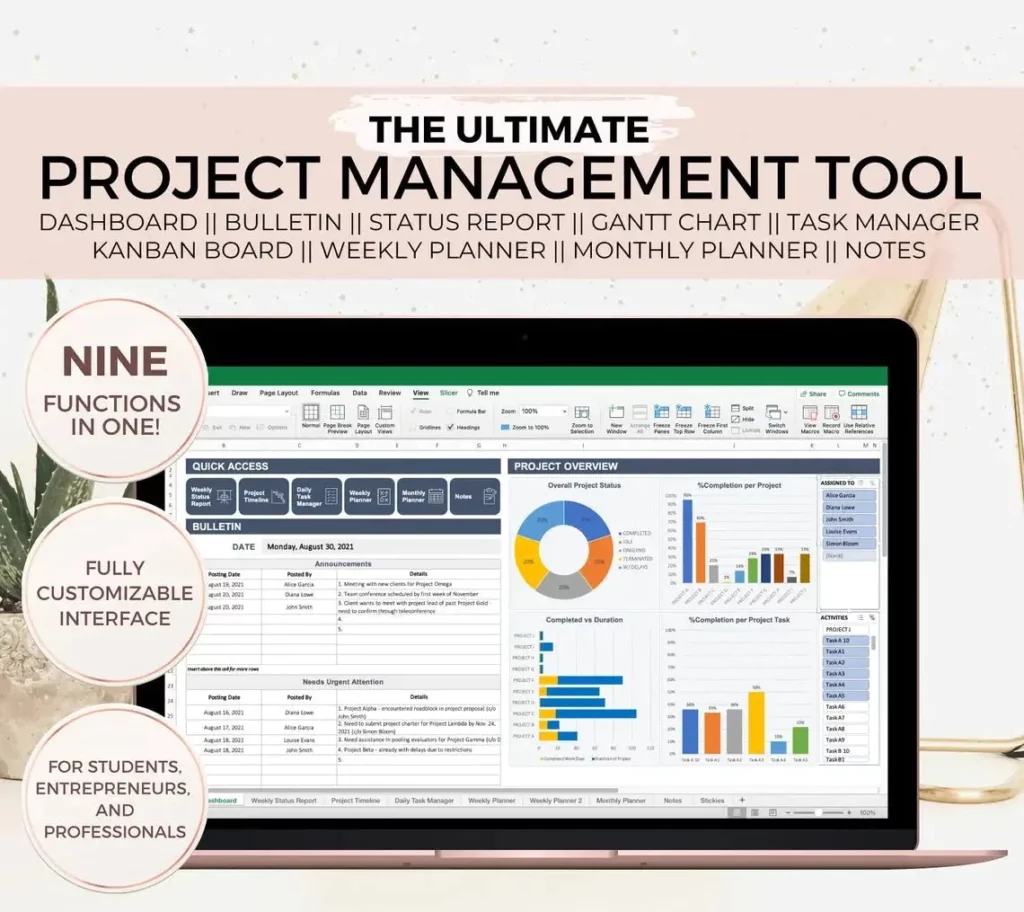
When creating a Gantt chart, it’s important to accurately estimate task durations and dependencies to ensure a realistic and achievable schedule. Regular updates to the Gantt chart are essential to reflect changes in the project timeline and keep stakeholders informed. Project managers should also consider using Gantt chart software that offers features such as task dependencies, resource allocation, and progress tracking. By leveraging the full capabilities of Gantt chart tools, project managers can effectively plan, execute, and monitor projects to successful completion.

The Importance of Gantt Charts in Project Management
Improved Planning and Scheduling
Gantt charts are essential tools in project management as they provide a visual representation of the project’s timeline, tasks, and dependencies. By using Gantt charts, project managers can effectively plan and schedule tasks, allocate resources, and set realistic deadlines. This helps in avoiding bottlenecks, reducing project delays, and ensuring that the project stays on track.
Enhanced Communication and Collaboration
One of the key benefits of Gantt charts is that they facilitate communication and collaboration among team members. With a clear overview of the project’s timeline and tasks, team members can easily understand their roles and responsibilities, as well as the dependencies between different tasks. This leads to improved coordination, better teamwork, and ultimately, a more successful project outcome.
Effective Resource Management
Gantt charts also play a crucial role in resource management. By visualizing the allocation of resources across different tasks and phases of the project, project managers can identify potential resource conflicts, optimize resource utilization, and make informed decisions about resource allocation. This ensures that the project is completed within budget and with the available resources.

How to Create and Use Gantt Charts Effectively in Project Management
Understanding Gantt Charts
Gantt charts are a popular tool used in project management to visually represent the schedule of a project. They display tasks or activities on the vertical axis and time on the horizontal axis, allowing project managers to see the duration of each task and how they overlap with one another. This visualization helps in planning, scheduling, and tracking the progress of a project.
Creating a Gantt Chart
Creating a Gantt chart involves identifying the tasks, estimating their duration, and determining their dependencies. Once these details are gathered, project managers can use specialized software or tools to input the information and generate the chart. It’s important to regularly update the chart as the project progresses to reflect any changes in the schedule.
Using Gantt Charts Effectively
When using Gantt charts, it’s essential to keep them up to date and communicate any changes to the team. They can be used to identify critical paths, allocate resources, and track milestones. Additionally, Gantt charts can help in identifying potential bottlenecks and adjusting the schedule accordingly to ensure the project stays on track.
Gantt Chart vs. Other Project Management Tools: A Comparative Analysis
Functionality and Features
When comparing Gantt charts to other project management tools, it’s important to consider the functionality and features that each tool offers. Gantt charts are known for their visual representation of project timelines, allowing users to easily see task dependencies and deadlines. On the other hand, other project management tools may offer features such as task assignment, file sharing, and communication tools. While Gantt charts excel in visualizing project timelines, other tools may offer a more comprehensive set of features for team collaboration and task management.
Usability and User Experience
Usability and user experience are crucial factors to consider when choosing a project management tool. Gantt charts are often praised for their simplicity and ease of use, as they provide a clear and intuitive way to track project progress. However, other project management tools may offer a more user-friendly interface and a smoother workflow for task management and team collaboration. It’s important to weigh the trade-offs between the visual simplicity of Gantt charts and the user experience of other tools when making a decision.
Integration and Compatibility
Integration and compatibility with other software and tools are important considerations for project management. Gantt charts may have limitations in terms of integration with other project management tools, while other tools may offer seamless integration with popular software and platforms. It’s essential to assess the compatibility of each tool with your existing workflow and the ability to integrate with other tools that your team uses on a daily basis.
Tips for Optimizing Gantt Charts for Better Project Management
Utilize Gantt Chart Software with Advanced Features
When it comes to optimizing Gantt charts for better project management, the first step is to choose the right software. Look for tools that offer advanced features such as task dependencies, resource allocation, and progress tracking. These features will help you create more accurate and detailed Gantt charts, allowing for better project planning and management.
Keep Your Gantt Chart Updated and Accurate
One of the most important tips for optimizing Gantt charts is to keep them updated and accurate. As the project progresses, make sure to regularly update the chart with the latest information on task completion, resource allocation, and any changes in the project timeline. This will help you stay on top of the project and make informed decisions based on real-time data.
Use Color Coding and Labels for Better Visualization
Color coding and labels can greatly improve the visualization of your Gantt chart. Use different colors to represent different types of tasks or milestones, and add labels to provide additional context. This will make it easier for team members to quickly understand the status of the project and identify any potential bottlenecks or delays.
Conclusion
In conclusion, the Gantt chart is an essential tool for project managers to effectively plan, organize, and track project progress. Understanding the Gantt chart and its importance in project management is crucial for successful project execution. By learning how to create and use Gantt charts effectively, project managers can streamline their project management processes and improve overall productivity.
When comparing Gantt charts to other project management tools, it’s clear that they offer unique advantages in visualizing project timelines and dependencies. However, it’s important to optimize Gantt charts for better project management by following best practices and utilizing advanced features.
As a final tip, project managers should consider integrating Gantt charts with other project management tools and software for a more comprehensive approach to project planning and execution. By doing so, they can maximize the benefits of Gantt charts and enhance their project management capabilities.
Overall, the Gantt chart is a powerful tool that can significantly improve project management processes when used effectively. Project managers should continue to explore and leverage the full potential of Gantt charts to drive successful project outcomes.
Thank you for reading our comprehensive guide on the Gantt chart in project management. We hope this information has been valuable to you and that you can apply these insights to enhance your project management practices.

